Kinship matrices
Quantitative genetics is the craddle of mixed modeling, and pyreml tributes it with a handful of helpers dedicated to build genetic relatedness matrices. This matrices serve as right_hand="str" known covariances, structuring the genetic random effects of biological units.
Random(
    unit         = "ID",
    right_hand   = "str",
    covariance   = K,
    matrix_index = ped["id"].tolist(),
)
These helpers are direct transpositions of established R tools.
Additive relationship
A pedigree helper prepare_pedigree is available. It expects a pandas DataFrame with columns id, dam and sire (parents may be missing). The preparation includes:
lowering and checking the column names,
coercing the various missing markers to properly handled
NaN,dropping duplicate individuals,
adding founder rows for any parent referenced but not itself listed.
import numpy as np
import matplotlib.pyplot as plt
import seaborn as sns
from scipy.stats import norm

from pyreml import (
    prepare_pedigree,
    A_pedigree,
    D_pedigree,
    larix as df,
    A_genomic,
)

ped = prepare_pedigree(df[["ID", "SIRE", "DAM"]])
Then, A_pedigree transposes makeA from the R package nadiv.
A = A_pedigree(ped)Dominance relationship
D_pedigree transposes makeD from nadiv. It derives the dominance relationship matrix \(\mathbf{D}\) from \(\mathbf{A}\): for two individuals \(k \neq j\) with dams \(d\) and sires \(s\) (Shaw et al., 1998; Wolak & Keller, 2014):
\[ D_{kj} = \tfrac{1}{4}\left( A_{d_k d_j} A_{s_k s_j} + A_{d_k s_j} A_{s_k d_j} \right), \qquad D_{kk} = 2 - A_{kk}. \]
Caution:
this construction is an approximation that is only exact in the absence of inbreeding. Under inbreeding, it becomes unreliable (Ovaskainen et al., 2008).
whenever a single parent is missing, the individual is treated as a founder.
D = D_pedigree(ped)

fig, axes = plt.subplots(1, 2, figsize=(10, 4))
sns.heatmap(A, cmap="coolwarm", center=0, ax=axes[0], square=True)
axes[0].set_title("A (additive)")
sns.heatmap(D, cmap="coolwarm", center=0, ax=axes[1], square=True)
axes[1].set_title("D (dominance)")
plt.tight_layout()
plt.show()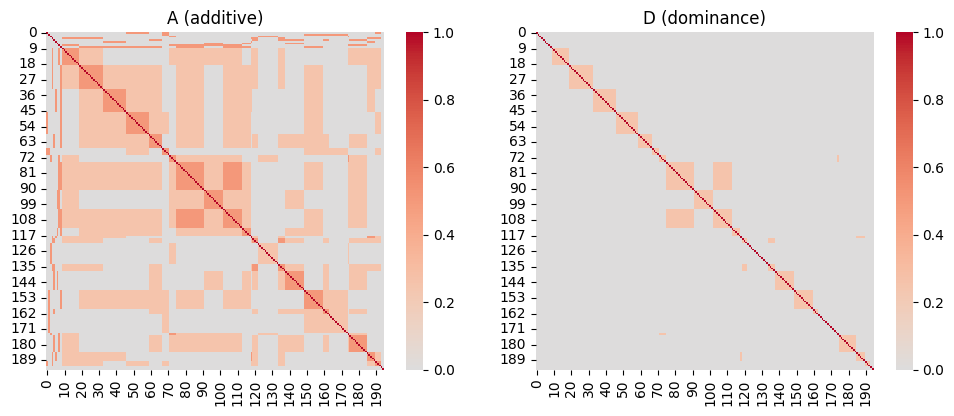
Genomic relationship
The genomic relationship matrix A_genomic transposes the A.mat function of the R package rrBLUP. It builds a genomic relationship matrix from a numpy marker matrix X of a diploid species, coded \(-1, 0, 1\); with individuals in rows, markers in columns.
Relatedness is computed using VanRaden (2008) approach. Setting shrink=True applies the Endelman–Jannink (2012) shrinkage for conditionning the matrix.
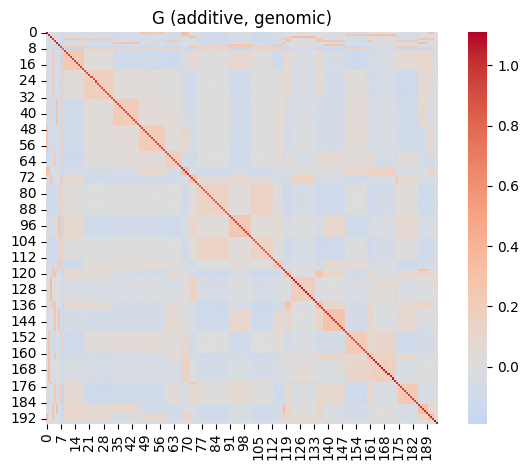
As an illustration, let’s realize the naive simulation of an SNP genotype matrix from the pedigree relatedness.
rng = np.random.default_rng(42)
n = A.shape[0]
m = 10_000
maf = rng.uniform(0.05, 0.95, size=m)
thr = norm.ppf(1 - maf)
L = np.linalg.cholesky(A)
X = np.zeros((n, m))
for l in range(m):
    g1 = (L @ rng.standard_normal(n)) > thr[l]
    g2 = (L @ rng.standard_normal(n)) > thr[l]
    X[:, l] = (g1.astype(float) - 0.5) + (g2.astype(float) - 0.5)  #

# compute the genomic kinship
G = A_genomic(
    X,
    min_MAF     = 0.05,
    max_missing = 0.1,
    shrink      = True
)

sns.heatmap(G, cmap="coolwarm", center=0, square=True)
plt.title("G (additive, genomic)")
plt.tight_layout()
plt.show()